library(tidyverse)
library(nycflights13)Ch.12 Solutions
Prerequisites
12.2.4 Exercises:
Looking at documentation you will come across a variable called
.Machine$double.epsfor which you can also read documentation. The function works by taking the different of the two supplied vectors and seeing if it is less than the smallest x s.t. 1 + x != 1 for your machine (but you can supply other tolerance levels if you want).near(sqrt(2)^2, 2) ## [1] TRUECode below:
flights |>
  mutate(
    dep_time_na = is.na(dep_time),
    sched_dep_time_na = is.na(sched_dep_time),
    dep_delay_na = is.na(dep_delay)
  ) |>
  count(dep_time_na, sched_dep_time_na, dep_delay_na)
## # A tibble: 2 × 4
##   dep_time_na sched_dep_time_na dep_delay_na      n
##   <lgl>       <lgl>             <lgl>         <int>
## 1 FALSE       FALSE             FALSE        328521
## 2 TRUE        FALSE             TRUE           8255
12.3.4 Exercises:
Made 2 separate tibbles.
# arr_delay missing but dep_delay populated
flights |>
  filter(is.na(arr_delay)&!is.na(dep_delay))

#neither arr_time nor sched_arr_time missing, but arr_delay is
flights |>
  filter(!is.na(arr_time)&!is.na(sched_arr_time)&is.na(arr_delay))
Used the across function to get counts for every column simultaneously.
flights |>
  count(is.na(dep_time))
## # A tibble: 2 × 2
##   `is.na(dep_time)`      n
##   <lgl>              <int>
## 1 FALSE             328521
## 2 TRUE                8255
flights |> filter(is.na(dep_time)) |> summarise(across(everything(), ~sum(is.na(.x)))) ## # A tibble: 1 × 19 ## year month day dep_time sched_dep_time dep_delay arr_time sched_arr_time ## <int> <int> <int> <int> <int> <int> <int> <int> ## 1 0 0 0 8255 0 8255 8255 0 ## # ℹ 11 more variables: arr_delay <int>, carrier <int>, flight <int>, ## # tailnum <int>, origin <int>, dest <int>, air_time <int>, distance <int>, ## # hour <int>, minute <int>, time_hour <int>- We see that when
dep_timeis null, thendep_delay,arr_time,arr_delayandair_timeare always null. My suspicion is that these fields are left unpopulated when the flight is cancelled.
- We see that when
I just did a plot, but some ideas for further analysis.
Make the size of points dependent on the number of flights.
Look into the fit of a regression line.
look if arr_delay has the same trend.
flights |>
  group_by(year, month, day) |>
  summarise(prop_cancelled = sum(is.na(dep_time))/n(),
            avg_delay = mean(dep_delay, na.rm = TRUE),
            .groups = 'drop') |>
  ggplot(aes(prop_cancelled, avg_delay))+
  geom_point()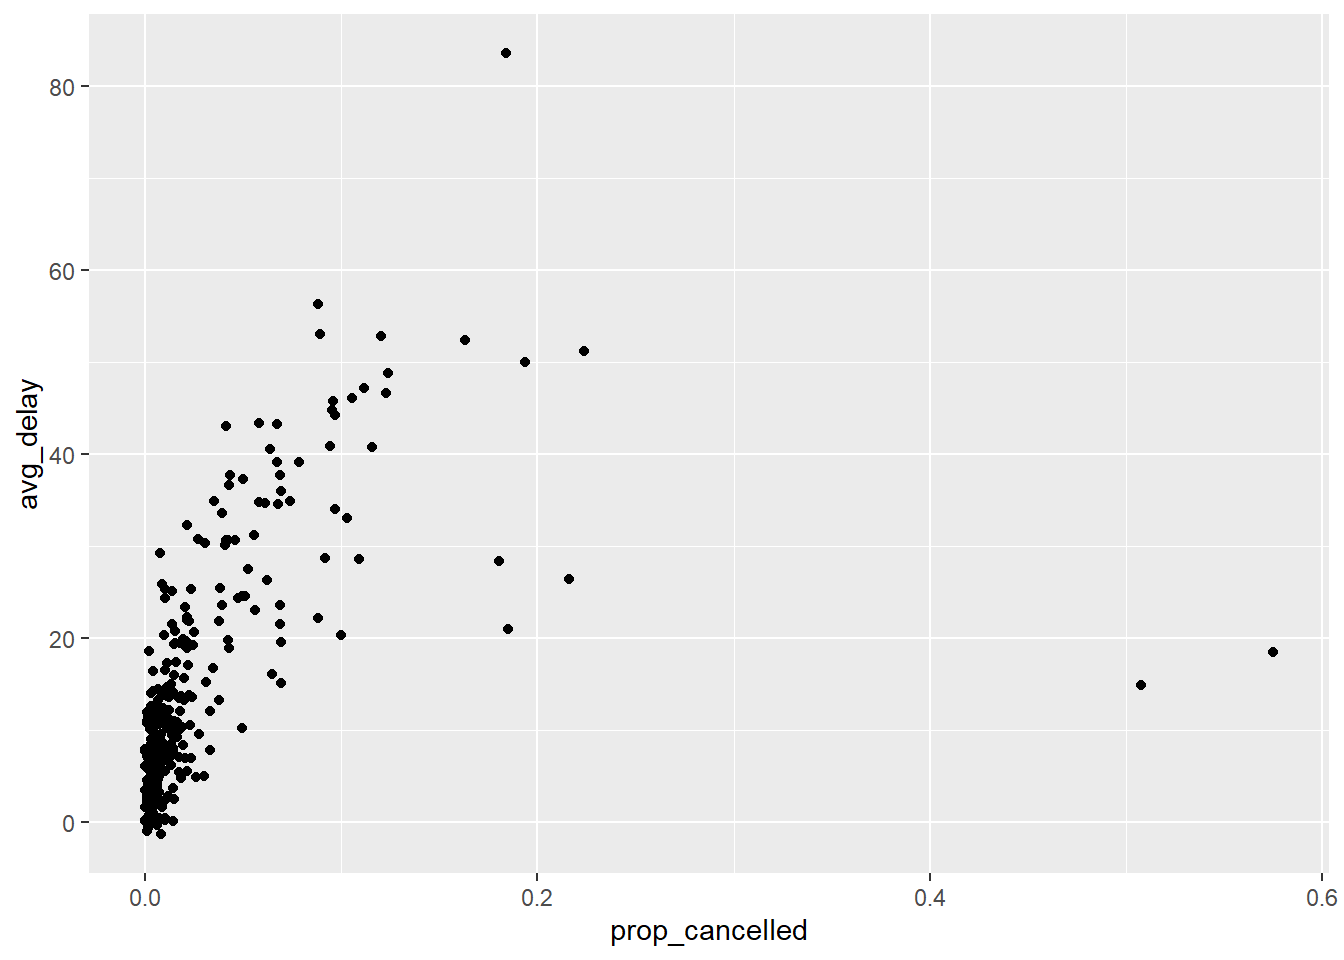
12.4.4 Exercises:
sum(is.na(x))gives the count of missing values in vector x.mean(is.na(x))gives the proportion of missing values in vector x.
Both
prod()andmin()are analogous toall().- since if any value in vector x is FALSE, then
prod(x)andmin(x)will return FALSE.
- since if any value in vector x is FALSE, then
12.5.4 Exercises:
Code below:
vector_0_20 <- (1:21)
if_else(vector_0_20%%2==0, 'EVEN', 'ODD')
##  [1] "ODD"  "EVEN" "ODD"  "EVEN" "ODD"  "EVEN" "ODD"  "EVEN" "ODD"  "EVEN"
## [11] "ODD"  "EVEN" "ODD"  "EVEN" "ODD"  "EVEN" "ODD"  "EVEN" "ODD"  "EVEN"
## [21] "ODD"
Code below:
days_of_week <- c('Monday', 'Tuesday', 'Wednesday', 'Thusday', 'Friday', 'Saturday', 'Sunday')
ifelse(days_of_week %in% c('Saturday', 'Sunday'), 'Weekend', 'Weekday')
## [1] "Weekday" "Weekday" "Weekday" "Weekday" "Weekday" "Weekend" "Weekend"
Code below:
sample_vector_x <- c(1, -4, 3, 2, 0 , -17.5)
print(if_else(sample_vector_x<0, -1*sample_vector_x, sample_vector_x))
## [1]  1.0  4.0  3.0  2.0  0.0 17.5
Can add more holidays but I am lazy:
flights |>
  mutate(holiday_boolean = case_when(
    month==12 & day == 25 ~ 'TRUE',
    month == 1 & day == 1 ~ 'TRUE',
    month == 12 & day == 31 ~ 'TRUE',
    .default = 'FALSE'),
  holiday = case_when(
    month==12 & day == 25 ~ 'Christmas',
    month == 1 & day == 1 ~ 'New Years',
    month == 12 & day == 31 ~ 'New Years Eve',
    .default = 'NA'
  ))