library(tidyverse)
library(arrow)ch_22_solutions
Prerequisites:
pq_path <- "../R-notes/Ch.22 Apache Arrow/data/seattle-library-checkouts"
seattle_pq <- open_dataset(pq_path)
22.5.3 Exercises:
By converting to a DuckDB table I am able to use the slice_max function.
slice_maxhas an argument to specify if you want ties or not, but if you code this question with anarrangethenslicecall you are without ties, and on the other hand you usefilter(x == max(x))you are getting ties.
seattle_pq |>
  to_duckdb() |>
  filter(MaterialType == "BOOK", Title != '<Unknown Title>') |>
  group_by(CheckoutYear, Title) |>
  summarize(TotalCheckouts = sum(Checkouts, na.rm = TRUE), .groups = 'drop_last') |>
  slice_max(TotalCheckouts, n = 1) |>
  collect()
## # A tibble: 18 × 3
## # Groups:   CheckoutYear [18]
##    CheckoutYear Title                                             TotalCheckouts
##           <int> <chr>                                                      <dbl>
##  1         2011 The help / Kathryn Stockett.                                2061
##  2         2018 Educated : a memoir / Tara Westover.                        5417
##  3         2005 Uncataloged Folder or Bag--DWN                              1905
##  4         2013 Where'd you go, Bernadette : a novel / Maria Sem…           3977
##  5         2006 Uncataloged Folder or Bag--DWN                              2437
##  6         2016 The girl on the train / Paula Hawkins.                      2727
##  7         2014 The goldfinch / Donna Tartt.                                2919
##  8         2017 The Underground Railroad : a novel / Colson Whit…           3525
##  9         2021 The vanishing half / Brit Bennett.                          3793
## 10         2020 Such a fun age : a novel / Kiley Reid.                      1776
## 11         2009 Margot at the wedding [videorecording] / Paramou…           3003
## 12         2019 Where the crawdads sing / Delia Owens.                      6913
## 13         2015 The girl on the train / Paula Hawkins.                      3333
## 14         2008 Margot at the wedding [videorecording] / Paramou…           2620
## 15         2022 The maid : a novel / Nita Prose.                            3145
## 16         2012 The hunger games / Suzanne Collins.                         2746
## 17         2007 Uncataloged Folder or Bag--DWN                              2196
## 18         2010 The help / Kathryn Stockett.                                2300
I interpreted this question to mean unique versions in the system, and therefore I took unique ISBNs in the system. If you interpret this question to mean most books (including duplicates) or most titles you will get different results.
seattle_pq |>
  filter(MaterialType == "BOOK", Title != '<Unknown Title>') |>
  group_by(Creator) |>
  summarize(TotalBooks = n_distinct(ISBN)) |>
  arrange(desc(TotalBooks)) |>
  collect()
## # A tibble: 224,936 × 2
##    Creator                                TotalBooks
##    <chr>                                       <int>
##  1 ""                                           8450
##  2 "Patterson, James, 1947-"                     307
##  3 "Christie, Agatha, 1890-1976"                 161
##  4 "Stilton, Geronimo"                           137
##  5 "Rylant, Cynthia"                             136
##  6 "Hunter, Erin"                                124
##  7 "Osborne, Mary Pope"                          123
##  8 "Warner, Gertrude Chandler, 1890-1979"        122
##  9 "Steel, Danielle"                             119
## 10 "Seuss, Dr."                                  115
## # ℹ 224,926 more rows
Notice that I use the
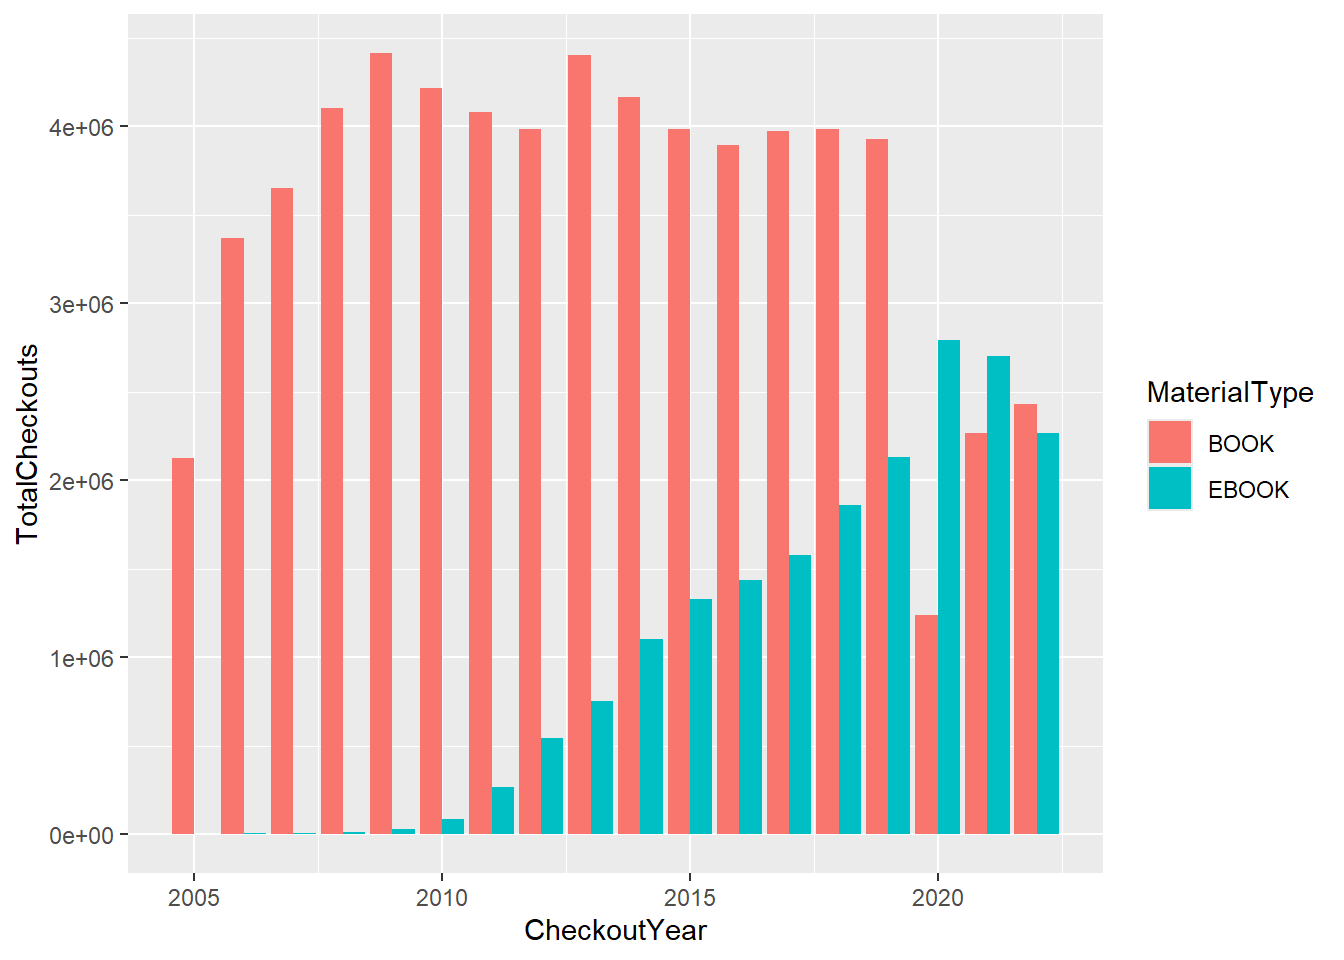
collectfunction before the ggplot call so it would take a dataframe as an input. It returns an error otherwise.seattle_pq |> filter(MaterialType %in% c('BOOK', 'EBOOK')) |> group_by(MaterialType, CheckoutYear) |> summarize(TotalCheckouts = sum(Checkouts), .groups = 'drop') |> arrange(CheckoutYear) |> collect() |> ggplot(aes(CheckoutYear, TotalCheckouts, fill = MaterialType)) + geom_bar(stat = 'identity', position = 'dodge')